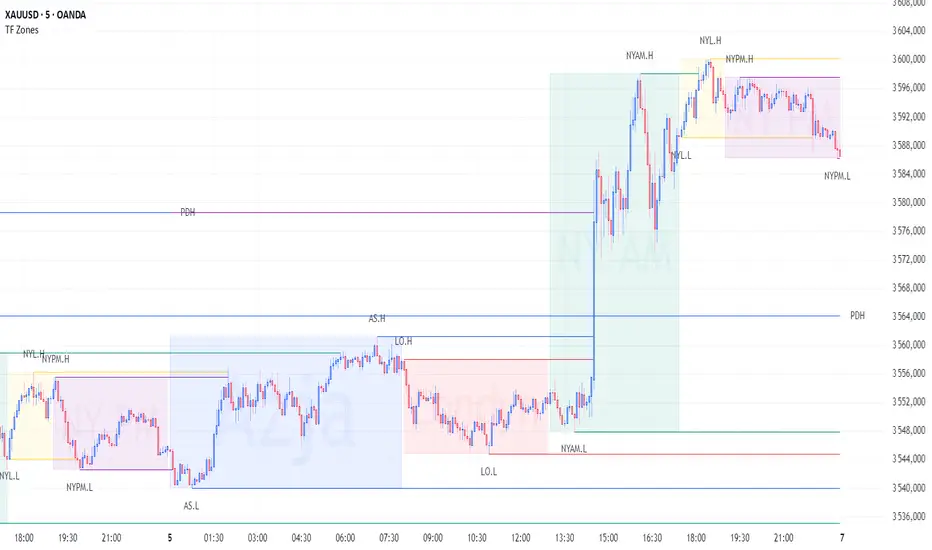
TF ZonesTF Zones – Timeframe & Session Zones Indicator
TF Zones is an advanced TradingView indicator that visualizes market session zones (Asia, London, New York) and key session, day, week, and month levels. It helps traders quickly identify important trading areas and potential reversal points.
Key Features:
Session Zones: Displays opening and closing hours of major markets, with customizable colors, labels, and transparency.
Session Lines: Automatically plots session highs, lows, and midpoints, with optional alerts when levels are broken.
Daily/Weekly/Monthly Lines (D/W/M): Shows open, high, and low for D/W/M intervals, with High/Low alert support.
Previous Year High/Low: Plots the previous year’s highs and lows on the chart for historical reference.
Day Labels: Optionally displays day-of-week labels and vertical lines marking the start of a new day.
Highly Customizable: Line style and thickness, colors, transparency, label positions, and more.
Alerts Support: Alerts for session line breaks, High/Low levels, and D/W/M points.
TF Zones is perfect for traders who want to visually analyze market activity across time zones and identify key support and resistance levels.
Cari skrip untuk "session high"
ICT Sessions & Killzones +PRO (VinceFxBT)ICT Sessions & Killzones +PRO (VinceFxBT)
All in one Session and Killzone script for FX, Futures and Crypto markets. It includes London, New York, CBDR & Asia Sessions and Killzones.
Features
Includes London, New York, Asia, CBDR sessions
Includes all ICT Killzones
Extended session highs/lows up to 90s back, until mitigated.
Set recurring alerts for session highs and lows
Includes Indices price levels and opens
Uses UTC timezones with automatic Daylight Saving Time so NO timezone correction needed ; ) Works out of the box for all regions, including different dates of DST for US/EU.
Session highs/lows displayed on chart as lines, box or background color
Customize line styles, width and colors
Customize colors for Sessions and Killzones
Optionally include weekends for Session or Killzone separately
Optionally display day separators and labels
Fully control which options are displayed at higher or lower timeframes. (e.g. hide sessions when timeframe is 1h or higher)
Session display options
Session Background Color.
Session High & Low Lines, including Session Middle Line.
Extended session highs/lows until mitigated
Extended Session Highs & Lows until mitigated.
Session Background Color with extended Asia Session Highs & Lows until mitigated.
Set recurring alerts for session highs and lows
Set automatic alerts when previous and/or current session levels are broken.

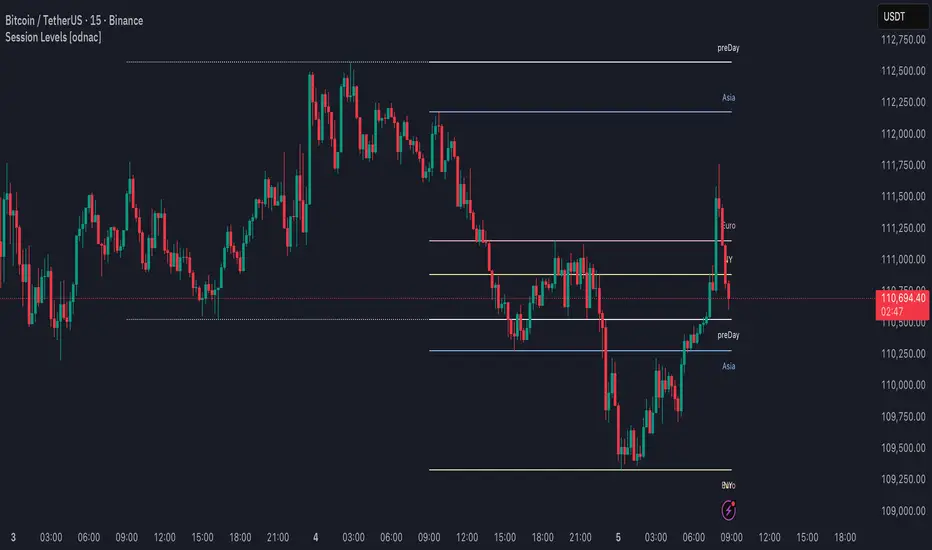
Session Levels [odnac]This indicator plots the high and low levels of the three main trading sessions—Asia, Europe, and New York—along with the previous day’s high, low, and open. Each session’s time range can be customized using a UTC offset, and the indicator automatically tracks session highs and lows as price develops.
Functions:
Plots session highs and lows for Asia, Europe, and New York.
Shows previous day’s high, low, and open as reference levels.
Session times are fully configurable with hour and minute precision, including UTC offset adjustment.
Each session level is marked with both a line and a label for clarity.
Color customization for each session and previous day levels.
Designed for intraday timeframes (1–60 minutes).
Filter Condition:
When the filter option is enabled, the indicator adjusts how levels are drawn:
A session high above the current close is displayed as a solid line with a visible label.
Once price closes above that high, the line becomes dotted and dimmed, and the label also becomes less emphasized.
Similarly, a session low below the current close is displayed as a solid line and label.
If price closes below that low, the line switches to dotted and dimmed, with the label adjusted accordingly.
This behavior highlights only the most relevant levels for the current market position while still keeping breached levels visible in a subdued style, making it easier to spot active breakout or liquidity zones.
ICT KEY LEVELS (L3J)📊 Overview
The ICT KEY LEVELS (L3J) indicator is a tool designed to automatically identify and display key levels based on Inner Circle Trader (ICT) concepts.
This indicator combines session-based levels with multi-timeframe highs/lows analysis to provide traders with critical price zones for decision-making.
Developed by L3J - This indicator can be used in conjunction with other indicators I have developed for enhanced market analysis.
🎯 Key Features
Session-Based Levels
- Previous Day High/Low (PDH/PDL): Automatically identifies and displays the previous trading day's high and low levels
- Asian Session Levels: Tracks high and low during Asian trading hours (20:00-03:00 GMT+4)
- European Session Levels: Captures London session high and low levels (03:00-08:30 GMT+4)
Multi-Timeframe Analysis
- H1 Pivot Levels: Identifies 2-candle reversal patterns on 1-hour timeframe
- H4 Pivot Levels: Detects 4-hour pivot points using advanced pattern recognition
- Smart Visibility: Levels are only shown on appropriate timeframes (H1 levels on H1, H4 levels on H4)
Advanced Features
- Priority System: Automatically hides overlapping levels based on importance (Previous Day > Sessions > H4 > H1)
- Dynamic Labels: Real-time labels that update with price action
- Intelligent Cleanup: Removes crossed or outdated levels to maintain chart clarity
- Customizable Anchoring: Choose between precise timestamp anchoring or candle middle anchoring
- Performance Optimized: Built with efficient code structure for smooth chart performance
⚙️ Configuration Options
Note: Currently, the user interface settings are displayed in French. This will be updated to English in a future version.
General Settings
- Timezone: Configurable timezone for session calculations (default: GMT+4)
- Trading Days: Number of trading days to analyze (1-20 days)
- Extension: Right extension length for level lines
- Anchoring Mode: Precise timestamp or candle middle anchoring
Visual Customization
Each level type (Asia, Europe, Previous Day, H1, H4) includes:
- Color Selection: Separate colors for highs and lows
- Line Styles: Solid, Dotted, or Dashed lines
- Line Width: Adjustable thickness (1-4 pixels)
- Show/Hide Toggle: Individual control for each level type
🕒 Session Times
- Trading Day: 18:00-16:00 (CME session)
- Asian Session: 20:00-03:00 GMT+4
- European Session: 03:00-08:30 GMT+4
All times are configurable and timezone-aware
📈 How It Works
Level Detection
1. Session Levels: Continuously tracks price action during specific trading sessions
2. Pivot Detection: Uses 2-candle reversal patterns (bullish then bearish for highs, bearish then bullish for lows)
3. Multi-Timeframe Data: Requests higher timeframe data for H1 and H4 analysis
Smart Management
- Automatic Cleanup: Removes levels that have been crossed or are too old
- Priority Filtering: Hides duplicate levels based on importance hierarchy
- Dynamic Updates: Real-time adjustment of level positions and labels
🎨 Visual Elements
- Horizontal Lines: Extend from level creation point to the right
- Dynamic Labels: Show level type and session information
- Color Coding: Different colors for each session and timeframe
- Transparency: Automatically hides overlapping or less important levels
🔧 Technical Specifications
- Pine Script Version: v6
- Chart Overlay: True
- Max Lines: 500
- Max Labels: 50
- Performance: Optimized with intelligent memory management
📋 Usage Tips
1. Best Timeframe: Works on all timeframes, but H1 and lower provide optimal detail
2. Combine with Price Action: Use levels as confluence zones for entry/exit decisions
3. Risk Management: Levels can serve as stop-loss and take-profit targets
4. Market Structure: Helps identify key support/resistance in market structure analysis
🔄 Compatibility
This indicator is designed to work alongside other L3J indicators for comprehensive market analysis.
📞 Support & Updates
For questions, suggestions, or updates, please contact L3J through TradingView messaging.
---
Disclaimer : This indicator is for educational and analysis purposes. Always practice proper risk management and never risk more than you can afford to lose.
Version: 1.0
Author: L3J
Last Updated: 30/08/2025

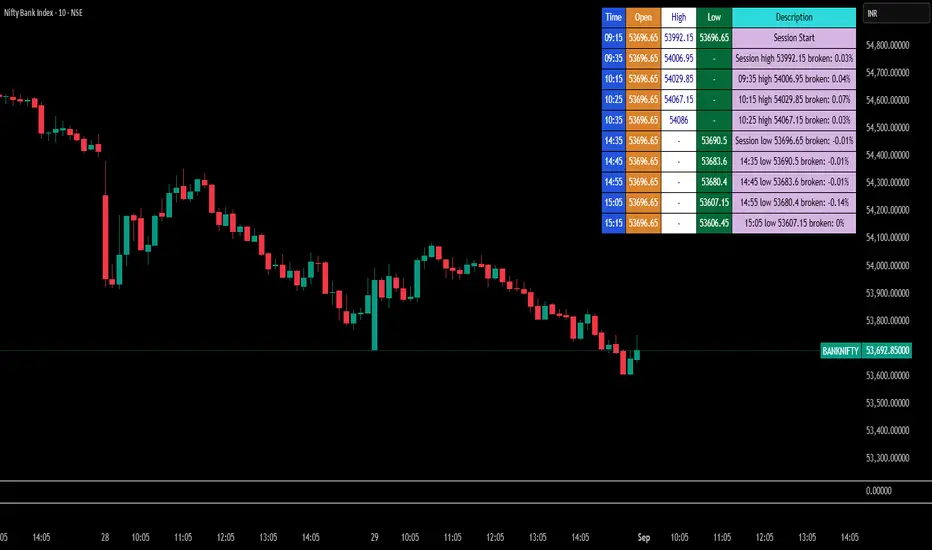
Break Point Record Table — GSK-VIZAG-AP-INDIA "Break Point Record Table — GSK-VIZAG-AP-INDIA" indicator captures key break points during each trading session and presents a clear, color-coded table overlay on the chart for quick visual reference. Specifically, it logs sessions' open price and monitors subsequent price action for notable breaks in the session high or low prices. Each break event is recorded with the time, price, and percentage change from the previous break, helping traders identify significant price movements within the session at a glance.
Key Features:
Records the session start time and opening price for context.
Tracks every intraday break above the previous session high or below the previous session low.
Calculates and displays the percentage change at each break event.
Highlights breaks with descriptive text including break time and values to aid trade decision-making.
Displays a table with columns for Time, Open, High, Low, and a Description of the event.
Uses color-coded cells to differentiate between session start, highs, lows, and break descriptions for better readability.
Maintains performance and readability by limiting the table to the latest 30 break events.
Usage & Benefits:
This indicator is ideal for intraday traders who want reliable visual cues to monitor momentum shifts and breakout/breakdown points during the trading day. By capturing these break points as discrete events and organizing the data into an easily accessible, visually intuitive table, it improves situational awareness and supports timely trading decisions.
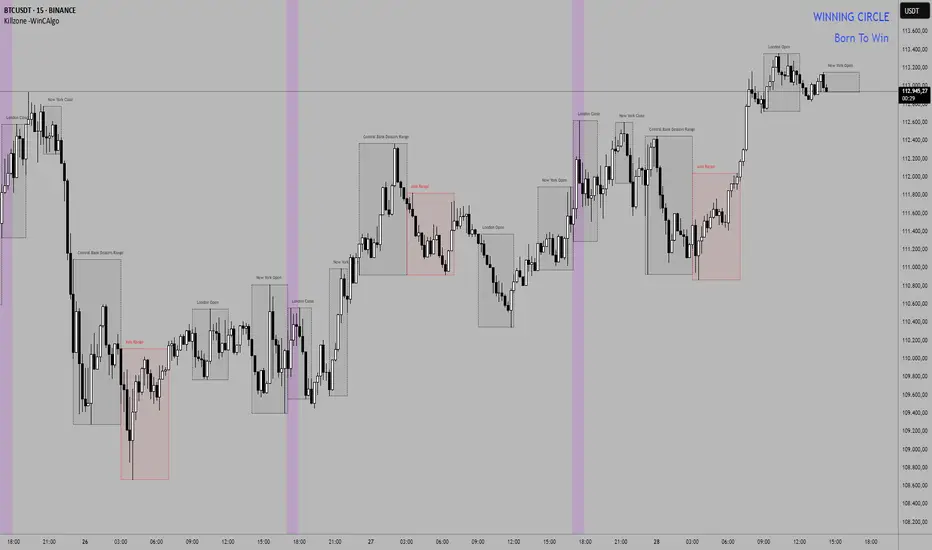
Killzone -WinCAlgoWhat is this Indicator?
The Killzone Trading Sessions Indicator is a comprehensive tool designed to identify and visualize the most important trading sessions across all financial markets. This indicator highlights key timeframes when institutional traders and market makers are most active, creating high-probability trading opportunities in stocks, crypto, commodities, and indices.
How to Use:
- Session Boxes: Each colored box represents a trading session's high and low range
- EQ-OTE Levels: Look for price reactions at 50% and 70% levels within sessions
- Silver Bullets: Purple background highlights high-probability reversal times
- CBDR Analysis: Use deviation levels to identify potential breakout targets
Trading Strategy:
- Wait for price to enter a killzone session
- Look for liquidity sweeps at session highs/lows
- Enter trades at EQ-OTE levels with proper risk management
- Use Silver Bullet times for precise entry timing
- Target deviation levels for profit-taking
Erendev - Sessions for SweepsDescription:
This indicator is designed for intraday traders who focus on liquidity sweeps and session-based market structure.
It automatically draws session boxes for Asia, London, New York, and New York PM and highlights the highs and lows of each session. These levels act as important liquidity reference points.
How it works:
Session Boxes: Visualizes each trading session (Asia, London, New York, NY PM) with adjustable colors and transparency.
Highs/Lows: At the close of each session, the indicator projects horizontal rays of the high/low until touched by price or until the day ends.
Daily Separators: Optional background stripes or vertical lines mark new trading days, helping traders distinguish daily cycles.
Day-of-Week Markers: Marks weekdays at the bottom of the chart to help align intraday patterns.
Alerts: Alerts trigger when price interacts with session highs/lows, allowing traders to track liquidity sweeps in real time.
Unique Concept:
Unlike generic session indicators, this script integrates session-based liquidity sweeps directly into the workflow. It’s not only showing the sessions but also tracks untouched highs/lows as liquidity pools—a key ICT-inspired concept.
By combining session timing, liquidity sweeps, and visual clarity, the tool provides a structured intraday map for traders.
Usage:
Works best on intraday timeframes (1m–60m).
Above 2H, visuals are automatically disabled to keep charts clean.
Traders can hide/show sessions individually and customize line styles, widths, and colors.
Can be used across Forex, Futures, and Indices for scalping or day trading.

ICT Session High/Low LevelsThis indicator automatically plots the Highs and Lows of completed sessions and draws lines for the Asian session and London session. Levels are displayed only after each session has closed. A simple tool for liquidity work and intraday context (SMC/ICT).

Bardhi's ICT Killzone & PivotsThis indicator is a complete ICT-style session and liquidity toolkit designed for precision trading. It automatically marks the most important trading windows (“Killzones”) and provides powerful tools for tracking price action around them.
Key Features:
Killzones: Automatically plots Asia, London, and New York (AM, Lunch, PM) sessions with customizable colors, transparency, and labels.
Session Highs, Lows & Midpoints: Dynamic lines for killzone highs/lows, optional midpoints, and alerts when levels are broken.
Range Statistics: Displays the real-time range of each session plus rolling averages in a customizable table.
Day / Week / Month Levels: Plots opens, highs, lows, and separators for higher-timeframe reference points with optional alerts.
Custom Opening Prices: Define up to 8 custom open lines (e.g., True Day Open, 06:00, 10:00) with cutoff times.
Vertical Timestamp Lines: Highlight important intraday times such as news events or personal strategy triggers.
Day-of-Week Labels: Clean labels for each day, with the option to hide weekends.
Full Customization: Adjustable label sizes, colors, line styles, transparency, and drawing limits.
Why Use It?
This tool combines killzone sessions, pivots, higher-timeframe opens/highs/lows, and range statistics into one clean, automated package. It saves time drawing manually, keeps charts organized, and helps traders apply ICT concepts consistently.

Smart Money Time (SMT)SMT Divergence – 90m / 30m / 10m (Prev-Cycle, Real-Time, Trailing)
Purpose:
This indicator finds SMT (Smart Money Technique) divergences between two related markets (e.g., CME_MINI:NQ1! vs CME_MINI:ES1! ). It does this per 90m/30m/10m cycles and only compares the current cycle to the immediately previous cycle —never older. It supports three cycle granularities:
90-minute cycles (9 blocks from 02:30–16:00 NY time)
30-minute sub-cycles (27 blocks)
10-minute sub-cycles (81 blocks; exactly 3 per 30-minute cycle)
For each cycle, the script tracks each symbol’s extreme (highest high for potential bearish SMT, lowest low for potential bullish SMT). When the leader sets a new extreme vs its own previous cycle while the lagger fails to do so vs its previous cycle, an SMT divergence is formed and plotted on the chart in real time. Lines trail as price makes new extremes within the same cycle.
What you’ll see on the chart:
A line from the previous cycle’s extreme to the current cycle’s extreme on the symbol pane where the indicator is applied (Primary A).
An optional text label at the current extreme (e.g., “90m SMT”, “30m SMT”, “10m SMT”).
Lines update (“trail”) as the current cycle goes on. When a new cycle begins, tracking resets for that cycle.
Default styling (editable):
90m SMT: solid, width 1, black
30m SMT: solid, width 1, black
10m SMT: dotted, width 1, black
You can toggle the text on/off and change width, style, and colors separately for 90m, 30m, and 10m.
Signals (definitions)
Bearish SMT: One market makes a Higher High vs its own previous cycle, while the other fails to make a Higher High vs its previous cycle.
Bullish SMT: One market makes a Lower Low vs its own previous cycle, while the other fails to make a Lower Low vs its previous cycle.
The line is drawn on Primary A by default.
Settings (explained)
Symbols
Primary Symbol A – the chart’s “leader/lagger” pane the script draws on.
Comparison Symbol B – the second market used for SMT checks.
Detection toggles
Detect SMT: 90m / 30m / 10m – turn on/off detection for each timeframe.
Note: The script always compares current cycle ↔ previous cycle only.
Validate candle direction
When enabled, the bar that makes the new extreme must also close in the confirming direction on that same market:
Bearish SMT: the bar that made the new Higher High must be a down close (close < open).
Bullish SMT: the bar that made the new Lower Low must be an up close (close > open).
This filter removes many “wick-only” probes and reduces false positives.
Turn off if you prefer to register SMTs on any intrabar extreme, regardless of bar close.
Delete SMT when invalidated
After an SMT forms, if the lagger later breaks the previous extreme it initially failed to break, the divergence is considered invalid and the script deletes the line and its label. (An “SMT invalidated” alert can fire if alerts are enabled.)
Enable alerts
Fires on SMT formed (separate messages for 90m/30m/10m and bullish/bearish) and on SMT invalidated.
To use, click Create Alert on the indicator and choose “Any alert() function call”. Use “Once per bar” (or per bar close) to taste.
Appearance – per timeframe (90m / 30m / 10m)
Bullish/Bearish colors, Line width, Line style, Show text (toggle subtitle label).
Text Options
Text color, Text size, Text offset (vertical spacing from the extreme).
How to use
Add to chart and select two related markets, e.g., NQ (A) vs ES (B).
Choose which cycles to monitor (90m / 30m / 10m).
Optionally enable Validate candle direction to demand a confirming close on the bar that made the extreme.
Watch for plotted SMTs:
Bearish SMT (HH vs no HH) often signals potential weakness
Bullish SMT (LL vs no LL) often signals potential strength
Use SMTs as context/confluence—e.g., near session highs/lows, liquidity pools, PD arrays, or your own levels. Combine with structure, order flow, and risk rules.
Turn on alerts to be notified when SMTs form or are invalidated in real time.
Notes & behavior
New-York session timing: Cycles are fixed windows in America/New_York and automatically handle DST.
Real-time & trailing: Lines trail to the most recent extreme within the same cycle but there’s no look-ahead across cycles.
No repaint across cycles: Each signal is strictly current cycle vs previous cycle.
Cleanup: On invalidation the script deletes the label first, then the line, preventing orphan labels.
Tips
10m SMTs are more frequent/noisier; 90m are fewer but more meaningful. Many traders look for multi-frame agreement (e.g., a 30m SMT aligning with a fresh 10m SMT).
If you want fewer signals, keep Validate candle direction on; if you want maximum sensitivity, turn it off.
Disclaimer: Educational use only. Markets are risky; do your own research and manage risk responsibly.

Malama's KAYCAP Pre-Market Box# Pre-Market Single Candle Range Box
## What Makes This Script Original
While many scripts plot entire pre-market session ranges, this indicator focuses specifically on **a single user-defined candle** within the pre-market period rather than the entire session. This targeted approach allows traders to isolate the most relevant price action from a specific time (default: 4:00 AM EST) that often establishes key levels for the trading day.
## Core Methodology & Technical Implementation
**Single Candle Isolation:**
- Captures OHLC data from one specific minute within pre-market hours (user configurable)
- Differentiates between the candle's body (open/close range) and wicks (high/low extremes)
- Creates four distinct reference levels instead of traditional session high/low boxes
**Dual Box Structure:**
- **Inner Box (Body):** Plots the range between open and close prices of the target candle
- **Outer Boundaries:** Separately plots the high and low of that same candle
- **Visual Differentiation:** Uses different colors and line weights to distinguish body vs. wick levels
**Time-Specific Logic:**
The script uses precise time matching (`hour == boxHour and minute == boxMinute`) to capture data from exactly one candle, rather than aggregating an entire session. This creates four specific price levels:
- Box Top: Higher of open/close (body boundary)
- Box Bottom: Lower of open/close (body boundary)
- Box High: Candle high (wick extreme)
- Box Low: Candle low (wick extreme)
## Why This Approach Differs from Standard Session Boxes
**vs. Full Session Ranges:** Focuses on a single critical minute rather than entire pre-market period
**vs. Traditional S/R:** Creates both body and wick levels from one specific candle
**vs. Opening Range:** Uses pre-market data rather than regular session opening minutes
## Practical Application
The 4:00 AM EST default targets a time when institutional pre-market activity often establishes initial sentiment and key levels. By isolating this specific candle's range:
- **Body levels** often act as initial support/resistance during regular hours
- **Wick extremes** provide broader range boundaries for breakout analysis
- **Precise timing** allows focus on the most statistically relevant pre-market moment
## Technical Considerations
- Requires intraday timeframes (1-minute recommended) to capture specific candle data
- Time settings should match your broker's timezone for accurate candle selection
- Works best on liquid instruments where pre-market activity is meaningful
- The selected candle must exist in your data feed for the levels to plot
## Customization Options
All timing parameters are adjustable:
- Target candle hour and minute
- Pre-market session definition (for context)
- Visual styling for all four level types
This focused approach provides more granular analysis than broad session ranges while maintaining simplicity in execution.

FREEDOM - TJR Model\ FREEDOM – TJR Model\ 🚀
\ Automates TJR’s well-known NQ playbook with clean visuals, filters, and alerts—so you can focus on execution.\
\ Core idea\
1. Trade \ NQ\ in the \ New York session\ 🗽
2. Wait for a \ liquidity sweep\ of a \ prior session\ High/Low (Asia or London) ✂️
3. Confirm with \ SMT (NQ vs ES) divergence\ 🔀
4. Act on a \ proprietary entry signal\ 🔒
5. Risk at the swing 🛡️, target \ untapped internal/session liquidity\ 🎯
This indicator draws those session levels for you, tracks sweeps, detects SMT, applies higher-timeframe confluence, and fires alerts that respect your time window and filters.
---
\ What it draws & detects\
\ • Sessions & Liquidity Sweeps\ 🕒
* Plots \ Asia / London / New York\ session bands.
* On session close, it freezes the session’s \ High/Low\ as dotted “previous-session levels” and \ extends them forward\ until price \ crosses\ (choose \ Wicks\ or \ Close\ ).
* When price takes a previous-session \ High\ → \ Buyside sweep\ ; takes a \ Low\ → \ Sellside sweep\ .
* Optional \ Sweep Zones\ expand around the swept level using an \ ATR(21)\ margin; can auto-fade “fake” sweeps.
\ Tip: Keep “Extend previous session High/Low until cross” ON to maintain a clean roadmap into NY open.\
\ • SMT Divergence (NQ vs ES)\ 🔀
* Classic pivot-to-pivot SMT:
* \ Bearish SMT\ = NQ makes a \ higher high\ while ES does \ not\ .
* \ Bullish SMT\ = NQ makes a \ lower low\ while ES does \ not\ .
* Draws \ lines\ from pivot to pivot (no chart spam), with optional inline “SMT” label and optional confidence \ score\ (0–100) based on strength + recency.
* Context aware:
* Only shows \ Bearish SMT\ after a \ buy-side sweep\ (previous-session High taken).
* Only shows \ Bullish SMT\ after a \ sell-side sweep\ (previous-session Low taken).
* Respects your \ NY time window\ if enabled.
\ • Proprietary Entry Signals\ 🔒
* Prints entry lines + arrows only when your rules align (proprietary detection under the hood).
* Respects:
* \ Session-sweep bias\ (optional): Sells only after buy-side sweep; Buys only after sell-side sweep.
* \ Monotonic filter\ : new Sell must be \ higher\ than last Sell; new Buy must be \ lower\ than last Buy (resets each session).
* \ Minimum distance\ to nearest previous-session dotted level (in ticks).
* \ NY time filter\ window.
* \ HTF confluence\ (see below).
---
\ HTF Confluence (optional)\ 📈
* Choose \ MA slope\ (\ EMA/SMA/RMA/WMA\ ) or \ HH/HL structure\ on a higher timeframe (e.g., 60m/240m).
* Entry arrows and alerts can be gated so they only print when HTF bias agrees with the setup.
\ Tip: Start with EMA 50 on 60m for a smooth directional filter; add HH/HL only if you want stricter structure confirmation.\
---
\ Dashboard (bottom-right)\ 🧩
* \ VWAP state\ :
* \ Overbought\ (🔴) if close > VWAP + (mult × stdev)
* \ Oversold\ (🟢) if close < VWAP − (mult × stdev)
* Otherwise \ Neutral\ (⚪️)
* \ Premium / Discount\ vs previous-session 50% midline: Premium = above (red bias), Discount = below (green bias).
* \ SMT row\ : Bullish / Bearish / Neutral with optional score.
---
\ How to use the settings (quick tour)\
\ ENTRY\
* \ Entry Swing Length\ : lower = more signals.
* \ Confirmation\ : \ Candle Close\ or \ Wicks\ for breakout.
* \ Filter entry by session sweeps\ : enforces “sell after buy-side sweep, buy after sell-side sweep.”
* \ Minimum distance (ticks)\ : blocks entries too close to previous-session dotted levels.
* \ Replay mode\ : keeps entries visible in Bar Replay.
* \ NY Time filter\ : default \ 08:00–14:00 NY\ ; arrows/alerts respect the window.
* \ Arrow offset (ticks)\ : how far above/below the candle to plot the arrow.
\ SESSION SWEEPS\
* Toggle \ Buyside/Sellside zones\ , adjust \ ATR(21)\ margin & length.
* \ Hide Fake Sweep Zones\ (default ON).
* \ Extend H/L until cross\ (Wicks/Close).
* Optional \ daily reset\ for unswept dotted lines.
\ SESSIONS\
* Enable/disable \ Asia, London, NY AM, NY PM\ ; set start/end; choose color; extend midline if desired.
* DST toggles for NY/London.
\ HTF Confluence\
* Turn it ON/OFF; pick timeframe & method (MA slope or HH/HL); set MA type/length or swing length.
\ Dashboard\
* Show/hide table; set VWAP stdev length/multiplier.
* SMT settings: comparison symbol (\ default ES1!\ ), pivot length, show score/labels, recency window, etc.
\ Alerts\ (always last) 🔔
* \ Session line cross\ : choose Highs/Lows and crossing mode (\ Same as extension / Wicks / Close\ ).
* \ Entry alerts\ : \ Filtered / Unfiltered / Both\ .
* \ Filtered\ = respects sweep bias, HTF confluence, minimum distance, monotonic rule, and time window.
* \ Unfiltered\ = ignores sweep bias/HTF/monotonic (still respects minimum distance + time window).
* All entry alerts also respect the \ NY time window\ when enabled.
---
\ Suggested workflow\
* Open NQ on a 1–5m chart.
* Let the dotted \ previous-session H/L\ extend into NY; wait for a \ sweep\ .
* Check \ SMT\ : after buy-side sweep → look for \ bearish SMT\ ; after sell-side sweep → look for \ bullish SMT\ .
* Take the \ proprietary entry\ when filters agree.
* Stop at the swing; aim for \ untapped internal/session liquidity\ .
* Let \ alerts\ handle the monitoring.
---
\ Why traders like it\
* It mirrors the model popularized by \ TJR\ while removing the chart admin: sessions, sweeps, SMT, HTF gating, distances, monotonic sequencing, time windows, and ready-to-use alerts—so your execution stays consistent. ✨
---
\ Disclaimer\ ⚠️
\ This tool is for educational purposes only and does not constitute financial advice. Markets involve risk; always do your own research and test in replay/paper before trading live. FREEDOM – TJR Model is inspired by TJR’s publicly known framework but is not affiliated with, endorsed by, or sponsored by TJR. You are solely responsible for your trading decisions and outcomes.\

Session Liquidity [TakingProphets]Session Liquidity
Session Liquidity maps the intraday landscape that ICT/SMC traders care about: each session’s high/low prints, key opens (Midnight, True Day/6PM, 8:30), and prior period reference levels (Previous Week/Day and optional Mon/Tue/Wed). It auto-draws and extends clean horizontal levels, updates them live, and optionally preserves “mitigated” tags so you can review what price consumed. To keep charts readable, overlapping labels at the same price are merged into a single combined label (e.g., LON.H + PDH + PWH) with smart anti-overlap placement.
What it does (at a glance)
– Tracks Asia, London, NY AM, NY Lunch, and NY PM session highs/lows in your chosen timezone (default America/New_York).
– Draws key opens: Midnight Open, True Day Open (6 PM), and 8:30 Open.
– Plots Previous Week High/Low (PWH/PWL) and Previous Day High/Low (PDH/PDL) with optional Mon/Tue/Wed references.
– Live extension: lines extend to the current bar; when a level is traded through you can either remove it or keep a left-anchored “mitigated” label.
– Combined labels: when multiple levels share the same price, the script shows one label listing all tokens (e.g., LON.L + PWL).
– Timeframe governor: a Timeframe Limit hides drawings on higher resolutions to avoid clutter (e.g., show on ≤ 30 min only).
– Styling controls: per-feature colors, dotted/dashed/solid styles, and label size/position (session labels left/center/right logic handled via label types and offsets).
How it works:
– Sessions are defined with TradingView’s session input strings. While you are “in session,” the script updates running highs/lows and stores their bar indices. When the session closes, it freezes the prints and draws two horizontal lines: one at the session high (token “ASIA.H”, “LON.H”, “NYAM.H”, “NYLU.H”, “NYPM.H”) and one at the session low (“…L”).
– Prior period levels come from higher-timeframe requests: Previous Week’s High/Low from W, Previous Day from D (plus Mon/Tue/Wed using simple daily offsets). New periods wipe and redraw lines/labels cleanly.
– Key opens are stamped exactly when they occur (00:00 for Midnight, 18:00 for True Day, 08:30 for the print), then extended forward.
– Mitigation logic: if price trades beyond a level, either remove it entirely (Show Mitigated Levels = off) or stop extending the line and drop a small, persistent left-justified label where mitigation occurred (Show Mitigated Levels = on).
– Label combining: on each update, per-level labels are optionally cleared and replaced with one combined label per price level. The script groups by tick index, merges tokens (e.g., LON.H + PDH), and uses a small vertical offset loop to avoid label collisions at the same x-position.
Inputs you control
– Timeframe Limit: drawings will not appear on charts greater than or equal to this resolution.
– Timezone: default America/New_York.
– Label Settings
– Show Labels / Show Session High/Low Levels.
– Show Mitigated Levels: keep a small label where a level was traded through.
– Combine overlapping level labels: merge tokens into one label if prices match.
– Label sizes for levels and for session start/end text (sizes: Tiny/Small/Normal/Large).
– Visual Settings
– Colors for level lines and label text.
– Styles (Solid/Dashed/Dotted) for Previous Week and Previous Day blocks.
– Custom Labels
– Rename tokens for each session print (e.g., ASIA.H, LON.L, NYAM.H, etc.) to match your playbook.
– Key Opens
– Toggle Midnight Open, True Day Open (6 PM), and 8:30 Open lines; customize colors.
– Previous Week / Previous Day
– Toggle PWH/PWL and PDH/PDL; optionally plot Mon/Tue/Wed reference prints.
– Macro Sessions (toodegrees-style bracket)
– Toggle two macro windows (9:45–10:15 and 10:45–11:15).
– Choose bracket height in ticks, line style, label size/text, and optional price projection.
– The bracket is dynamic during its window (extends across the window; top adapts to new highs + chosen height; label centers on completion).
How to use it:
Pick your Timeframe Limit (e.g., 30) so the map only shows where you execute.
Enable the sessions you trade and keep the timezone aligned to your venue.
Turn on the prior period levels you care about (PWH/PWL, PDH/PDL, Mon/Tue/Wed).
Choose whether to preserve mitigated levels. If you journal, keeping mitigated tags helps with post-session review.
Enable combined labels to reduce clutter and spotlight confluence (e.g., LON.H aligning with PDH).
Use Macro windows for playbook timing (9:45–10:15, 10:45–11:15) to visualize typical volatility brackets.
Practical notes
– The indicator is a context and mapping tool; it does not produce signals. Use with your own bias, PD arrays, and execution model.
– Very long lookbacks or many toggles can push object limits on lower-powered machines. Use Timeframe Limit and feature toggles to keep things light.
– If you use custom sessions, ensure they do not overlap unexpectedly in your timezone.
– “Combine labels” intentionally removes per-level labels in favor of one merged label per price level; mitigated labels are preserved by design.
What’s unique here
– A full intraday “session print” system (Asia/London/NY AM/NY Lunch/NY PM) with clean freezing at session close and live line extension.
– True Day/Midnight/8:30 opens integrated into the same framework for a single, coherent liquidity map.
– Prior period structure (week/day + optional Mon/Tue/Wed) and toodegrees-style macro windows in one tool.
– Robust label merging by tick level with anti-overlap logic so multi-signal confluence is readable at a glance.

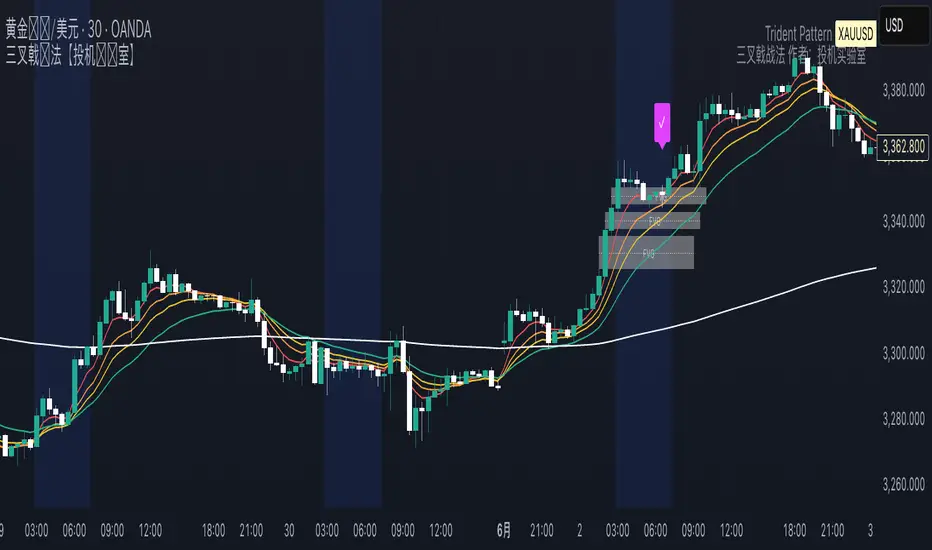
Trident Pattern [SpeculationLab]This indicator is based on the increasingly popular Trident strategy, and is best suited for the 30-minute timeframe. It performs particularly well on naturally bullish instruments such as gold, Bitcoin, and Nasdaq.All components of this indicator are original work by Speculation Lab.
Rather than stacking random features, this script is designed as a modular structure where each part works in synergy to build the Trident logic.
🔧 Modules Included:
Session Highlight — Visual display of the London Kill Zone
5 Customizable EMAs — Fully adjustable length, color, and toggling
Bullish Fair Value Gap (FVG) detection
Four types of Doji candlestick recognition
🧫 Logic Breakdown:
1. Time Session Filter
By default, the indicator highlights the London Kill Zone, defined as 03:00–06:30 New York time.Users can freely adjust the time zone, time range, and background color, with preconfigured zones including New York, London, Tokyo, Shanghai, and Sydney.
⚠️ Note: To maintain flexibility, the London Kill Zone is not enforced as a mandatory entry condition.
Users may apply it as an optional filter based on their own trading style.
2. 5 EMA Trend Filter
The script uses a five-EMA structure to confirm market trend.The default EMA lengths are 5, 9, 13, 21, and 200.A valid entry requires:
EMAs 5, 9, 13, 21 stacked in descending order
AND the 1-hour close is above EMA(200)
All EMAs are fully customizable and can be toggled on/off.
3. Bullish Fair Value Gap (FVG)
Bullish FVGs are detected using a 3-bar logic, from high to low .To filter noise, the gap must be greater than 0.7 × ATR(14) by default.Both the ATR period and multiplier are adjustable.
The FVG Extend setting has two roles:
It controls how many bars the FVG box extends to the right (default: 20)
It defines the active window for confirming entries within the FVG zone
Users can fully customize the box color, text, and center line.
4. Doji Detection
The script detects four types of Doji candlesticks:
Standard Doji
Long-legged Doji
Dragonfly Doji
Gravestone Doji
The Body Ratio setting controls how small the candle body must be relative to the full range (default ≤ 0.1).Long Wick Ratio and Short Wick Ratio further help fine-tune wick length criteria.
✅ Entry Signal Logic:
A Trident entry is confirmed when all the following conditions are met:
Trend Filter Passes
EMAs are stacked: 5 > 9 > 13 > 21
1H close is above EMA(200)
A Doji candle appears inside an active FVG zone
The next candle closes below the Doji’s high
If all conditions are satisfied, a Trident signal is triggered at the close of the confirming candle.
⚠️ Disclaimer
This indicator is intended for educational and research purposes only. It does not constitute financial advice or trading signals.Trading involves high risk. Please act according to your own risk management.Speculation Lab and the author bear no responsibility for any financial outcomes resulting from the use of this script.
本指标基于近年来日益流行的 Trident(三叉戟)策略,推荐使用在 30分钟时间框架,尤其适用于黄金、比特币、纳斯达克等具有自然上涨倾向的交易品种。本指标由 Speculation Lab 原创开发,结构严谨,逻辑清晰。
本指标采用模块化设计,各部分功能相辅相成,共同构建三叉戟策略逻辑,而非杂乱堆砌。
🔧 指标包含以下功能模块:
交易时段高亮 — 默认显示 伦敦杀戮区
五条可调节 EMA 均线 — 长度与颜色可自定义,模块可单独开关
看涨 Fair Value Gap(公平价值缺口)检测
四种 Doji(十字星)K线形态识别
🧫 逻辑说明:
1. 交易时段过滤
默认高亮显示的伦敦杀戮区为 纽约时间03:00–06:30。用户可自由调整 参考时区、具体时段和 背景颜色,支持预设时区包括纽约、伦敦、东京、上海和悉尼。
⚠️ 说明:为保持策略灵活性,伦敦杀戮区并非强制入场条件。
是否采用此过滤,可由用户自行决定。
2. 趋势过滤(五条EMA)
该指标采用五条 EMA 来确认市场趋势。默认长度为 5、9、13、21、200。入场信号要求满足以下条件:
EMA 5、9、13、21 从上到下依次排列(多头排列)
且 1小时图上的收盘价高于 EMA200
所有均线均可单独启用/关闭,长度与颜色均可自定义。
3. 看涨 FVG 区域识别
FVG 使用 3 根K线结构进行检测,从 high 到 low 。默认要求缺口 大于等于 0.7 × ATR(14),以过滤微小无效缺口。ATR周期与乘数均可自定义设置。
“FVG Extend”参数有两个作用:
控制图表上 FVG 区域箱体的右延伸长度(默认20根K线)
用作 FVG 活跃期的判断标准,仅在此区间内出现的 Doji 才会被视为有效信号触发条件
用户可自由设置 FVG 的背景颜色、文字样式与中线颜色。
4. Doji(十字星)识别
支持以下四种常见 Doji 形态识别:
标准十字星
长腿十字星
蜻蜓线(下影线长)
墓碑线(上影线长)
“Body Ratio” 控制实体占K线全长的比例,默认不超过0.2。“Long Wick Ratio” 与 “Short Wick Ratio” 可进一步调节影线长度识别标准。
✅ 入场信号逻辑:
符合以下所有条件时,触发三叉戟入场信号:
趋势过滤通过
EMA 依次排列为 5 > 9 > 13 > 21
且 1小时收盘价高于 EMA200
在 FVG 区域内出现有效 Doji 十字星
下一根K线收盘价 低于 Doji 的最高价
若以上条件均满足,则在确认K线收盘时触发三叉戟入场信号。
⚠️ 免责声明 Disclaimer
本指标旨在提供技术分析工具,仅用于教育与研究目的,不构成任何投资建议或交易指令。交易具有高风险,请根据自身风险承受能力合理操作。使用本脚本所导致的任何盈亏,作者与 Speculation Lab 不承担任何责任。
Liquidity Hours By HH🚦 Liquidity Hours By HH 🚦
This script highlights the major trading sessions on your chart — Asia, London KTW, and New York KTW — so you always know when the markets are buzzing! 🌏🕒
✨ Asia Session
Shows a colored box marking the entire session 🟣
Tracks the high and low with clear lines 📈📉
Optional midline that you can toggle ON/OFF 🔀 — perfect for spotting the session’s midpoint without cluttering your chart!
✨ London KTW & New York KTW Sessions
Displays clean boxes marking session duration 🟦🟩
No distracting high/low lines — just simple, neat session highlights
⏰ London session starts 1 hour earlier ⏰ — so you get an advanced heads-up for European market action! 🇬🇧
⏳ Boxes automatically hide on higher timeframes for a cleaner look 👀
Customize colors, durations, and toggle what you want to see — your chart, your rules! 🎨⚙️
Stay sharp and trade smarter with clear liquidity session zones! 💹🔥

Blue Ocean BOATS 24/5 US Market DataThis script utilizes Blue Ocean's ATS (Alternative Trading System) and U.S. exchange market data to create a continuous candlestick chart. The continuous data has the option to be used as an indicator or strategy source.
Requirements
The main chart symbol (which can be unrelated to the user-input Ticker Symbol) needs to be a 24/7 chart. An example symbol is CRYPTO:BTCUSD. CME_MINI:ES1! and FX:SPX500 work too, but are not truly 24/5 and will miss ~4 hours of the total trading week from the extended U.S. session.
The main chart's timeframe needs to be intraday. Because the script's output is currently inconsistent on daily or higher timeframes, it will disable itself.
The Ticker Symbol chosen should be a ticker that is traded on U.S. exchanges. This will provide both U.S. extended session data and a BOATS equivalent.
Usage & configuration
This script visualizes the 24-hour Monday-Friday chart of a U.S. exchange ticker. Going a step further, it can be used to compare the performance indices or cryptocurrencies to stock constituents of indices, cryptocurrency treasury stocks or holding ETFs.
The script's output, candlesticks, can be overlaid on the main chart or used as is. A "Price Source" plot is used for indicators or strategies.
Ticker Symbol: The U.S. ticker you'd like to view extended session and Blue Ocean ATS session data for.
Price Source: Price source that can be used for indicators or strategies.
Highlight Sessions: Highlight the different trading sessions.
Last Price Line: Show a horizontal line at the last traded price.
Ticker Symbol Check: Plots a label that will display only if the selected Ticker Symbol is not detected as a U.S. exchange traded ticker.
Earnings Label: Creates a label at the time of past earnings of the chosen Ticker Symbol. The time that the earnings are plotted is approximate. Because of this, the label is meant as an explanation for price action.
What this script does and how it works
It creates OHLC candlesticks by merging Blue Ocean's ATS market data and U.S. exchange data. From the OHLC data of both, a single output can be used for indicators or strategies.
References and further information
www.tradingview.com
The Blue Ocean ATS allows trading from 20:00 to 4:00 Eastern Time, Sunday through Thursday. This critical timeframe bridges the eight-hour overnight gap when major U.S. exchanges are closed.
blueocean-tech.io
Blue Ocean ATS, LLC is a US broker dealer which operates the alternative trading system BOATS. Our trading platform offers electronic access, price discovery, compliant regulatory reporting requirements, and standard clearing and settlement processes.
www.nyse.com
Hours mentioned are in Eastern Time.
Overnight trading remains far less active than extended hours trading. The hour with the highest overnight volume is 9:00PM, which averages 2.94 million shares per day and coincides with several Asian market opens. This volume is a fraction of the last hour of extended hours trading, which averages 43.22 million shares. The first hour of pre-core reported volume averages 113.30 million shares per day.
Overnight executions, in addition to the peak in the 9:00PM hour, also exhibits a smaller peak at 3:00AM, of 2.35 million shares. This coincides with several Asian bourses’ end of their regular trading day.
Example of using the script in the main chart window and the difference in how RSI may be calculated.
Note: ATS is not the name of the 20:00 to 4:00 ET session itself, and the term refers to a broader definition of trading systems that include dark pools, which can be different.
24/5 Monday-Friday really means NY time Sunday night to Friday afternoon.

EURUSD Kill Zone [Plazo Sullivan Roche Capital]EUR/USD Kil Zone
Core Logic: Navigating the New‑York Kill‑Zone
The EUR/USD Killzone is designed to exploit repeatable patterns that occur during the overlap of the London and New‑York trading sessions. Research shows that the New‑York “kill zone”—roughly 07:00–09:00 EST—produces the most dramatic moves in EUR‑ and USD‑linked currency pairs
During this window, large institutions often sweep out liquidity resting above or below the Asian and early‑London session extremes , triggering sharp reversals before a new intraday trend emerges. This is in contrast to the single pre-market sweeps occuring for GOLD/
This modeul uses ICT/Smart Money Concepts to read these patterns and waits for three confirmations before signalling a trade:
Liquidity Sweep & Rejection. Price must spike beyond the combined Asian and early‑London range and then reject that area (a sharp wick and opposite‑coloured candle), signalling that stops have been cleared. The module defines the Asian range from 00:00–05:00 EST and the London range from 02:00–05:00 EST, following the guideline that overlapping sessions produce the greatest volatility
Market Structure Break. It then waits for the 5‑minute price to close beyond the most recent swing high/low (pivot), confirming that a genuine shift in order flow has occurred rather than a simple stop‑run.
Fair‑Value‑Gap (FVG) Re‑Test. Upon the break, the script records the high and low of that 5‑minute “displacement” candle and defines a fair‑value gap—the imbalance between buyers and sellers. Rather than entering immediately, it sets a virtual limit order at the 50 % level of this gap. A trade is only triggered once price retraces to this mid‑point, providing a high‑probability, high‑reward entry.
These three filters help avoid common pitfalls when trading kill zones, such as false breakouts and news‑driven whipsaws. The indicator also monitors higher‑timeframe bias (4‑hour and daily charts) using 50‑ and 200‑period moving averages to gauge whether the intraday signal aligns with the broader trend.
Feature Set
The indicator provides a suite of visual and analytical tools to support disciplined trading:
Session Range Mapping: automatically draws the Asian (00:00–05:00 EST) and London (02:00–05:00 EST) session highs and lows, making it easy to see when price sweeps these levels.
Kill‑Zone Monitoring: a built‑in timer isolates the 07:30–09:00 EST window and limits the indicator to one trade per session to avoid over‑trading.
Pivot‑Break Detection: uses 5‑minute swing highs/lows to confirm that order flow has shifted before looking for entries.
Fair‑Value‑Gap Re‑test: defines an FVG from the displacement candle and waits for a 50 % retrace before triggering a signal. This improves risk‑to‑reward by entering at a discount (for longs) or premium (for shorts).
Higher‑Timeframe Dashboard: displays bullish/bearish/neutral biases on the 4‑hour and daily charts, plus a confidence rating (0–2) indicating how many of these timeframes agree with the signal direction.
Alerts: optional alerts can be configured for buy‑only, sell‑only or either‑direction signals.
Best Practices for Use
Align with Major Volatility Windows. The indicator is most effective during the New‑York kill zone. Avoid trading outside this window, and be aware of high‑impact news (e.g., FOMC announcements) that can distort price action
Check Higher‑Timeframe Bias. Use the dashboard to ensure the intraday signal aligns with the 4‑hour and daily trends. For instance, a long signal that aligns with a bullish daily bias carries higher conviction than one going against it.
Manage Risk Responsibly. Even with multiple filters, no strategy is foolproof. Use stop‑loss orders just beyond the liquidity sweep and size positions appropriately.
Combine with Fundamental Awareness. Check your economic calendar for European and U.S. data releases. If an important release occurs during the kill zone, consider standing aside or reducing risk.
Back‑test and Forward‑Test. Always validate the strategy across different market conditions and broker feeds. Pay attention to how spreads, volatility and news events influence the indicator.
Use as Part of a Toolkit. Consider combining the indicator with other confirmation tools such as momentum oscillators, volume analysis or price‑action patterns to refine entries further. Smart‑Money Concepts often use confluence, not a single signal.
What's in It for You?
The EUR/USD Liquidity Sweep Indicator distils institutional concepts—liquidity hunts, market‑structure shifts and fair‑value gaps—into an intuitive, automated tool. By waiting for a retrace into the displacement candle’s imbalance, it helps capture trades where risk‑to‑reward is skewed strongly in your favour. The dashboard encourages you to trade with the higher‑timeframe trend, and built‑in alerts ensure you never miss an opportunity.
In volatile kill‑zone environments, discipline and patience are vital. This indicator enforces both: it tracks session ranges, confirms structure, waits for a retrace, and triggers only when multiple conditions align. Coupled with sound risk management and your own judgement, it can become a cornerstone of a high‑probability trading plan.
Always remember that markets evolve. Continue to refine the indicator and your strategy as you gather more experience and data. The learning journey never ends, but this tool is designed to accelerate it.

MJBFX-Strategy (Futures Optimized)The MJBFX-Strategy is a complete market mapping tool designed to give traders a clear view of liquidity, session dynamics, and premium/discount levels. It loads automatically on any chart, fully optimized for futures and forex trading.
🔑 Key Features
Asian Session Range
Highlights the previous Asian session with a shaded box
Fixed until London open for precise reference
VWAP from Asian Session
Plots the VWAP of the previous Asian session
Dynamic fair value benchmark for intraday trading
Liquidity Sweeps (Optimized)
Detects sweeps of the Asian session high/low
Shown only on 30m, 1h, and 4h charts to reduce noise
Clean, minimal labels for clarity
Automatic Fibonacci Zone
Draws a shaded retracement zone (38.2%–61.8%) of the Asian range
Transparent fill makes it easy to read price action
Killzones
Highlights London (07:00–10:00) and New York (13:00–16:00) killzones
Semi-opaque shading to keep charts clean
Auto Trade Box (Risk/Reward)
On sweep confirmation, plots a 2R target box
Auto stop loss and take profit levels based on futures tick size
🎯 Why Use It?
The MJBFX-Strategy removes the need for manual drawing.It automatically maps:
Session highs and lows
Liquidity sweeps
VWAP and fib retracement zones
Key killzones
Perfect for session-based intraday trading in both futures and forex.
⚡ No manual settings required.Just load it onto your chart for an instant institutional view of the market.

RTH Standard Deviation+RTH Standard Deviation+ Indicator
Overview
The RTH Standard Deviation+ (RTH SD+) indicator is a versatile tool designed for traders to visualize key price levels based on the Regular Trading Hours (RTH) session.
It calculates and displays the high, low, equilibrium (midpoint), and standard deviation-based levels derived from the RTH session's price range.
This indicator is ideal for day traders and swing traders looking to identify potential support, resistance, and breakout zones.
Features
Customizable Session Window: Define the RTH session based on your preferred time window and timezone.
Key Price Levels: Displays high, low, equilibrium, 25%/75% quartile levels, and standard deviation levels (±0.5, ±1.0, ±1.33, ±1.66, ±2.0, and optional extended levels up to ±4.0).
Visual Elements: Includes horizontal lines, labels, boxes, and vertical lines to highlight key levels and session boundaries.
Flexible Styling: Customize line styles, colors, thicknesses, and visibility for all elements.
Extended Levels: Optional display of additional standard deviation levels (±2.25, ±2.33, ±2.5, ±2.66, ±2.75, ±3.0, ±3.25, ±3.33, ±3.5, ±3.66, ±3.75, ±4.0).
Deviation Boxes: Visualize specific standard deviation ranges (±0.1, ±1.33/1.66, ±2.33/2.66, ±3.33/3.66) with customizable colors.
Inputs
Session Window: Set the RTH session time (default: 06:00–09:00).
Timezone: Select the appropriate timezone (default: UTC-4).
Label Offset: Adjust the horizontal offset for price level labels (default: 5 bars).
Line Offset: Set the length of horizontal lines extending from the session end (default: 20 bars).
Show SD Levels: Toggle visibility of standard deviation lines (±0.5, ±1.0, ±1.33, ±1.66, ±2.0).
Show SD Labels: Enable or disable labels for standard deviation levels.
Show SD Boxes: Display shaded boxes for specific standard deviation ranges (e.g., ±1.33/1.66).
Show ±0.1 Dev Boxes: Highlight smaller deviation ranges (±0.1) with boxes.
Vertical Line: Toggle a vertical line at the session end, with customizable color, style, and thickness.
High/Low, Equilibrium, 25%/75%, ±0.1 Dev, ±1.33/1.66: Toggle visibility and customize colors, styles, and thicknesses for these levels.
Extended Levels: Enable additional standard deviation levels (e.g., ±2.25, ±2.5, etc.) for advanced analysis.
How It Works
Session Tracking: The indicator identifies the user-defined RTH session based on the specified time window and timezone.
It tracks the high, low, and equilibrium (midpoint) of the session's price action.
Price Range Calculation: At the session's end, the indicator calculates the price range (high - low) and uses it to compute standard deviation levels relative to the high, low, or equilibrium.
Level Visualization:
High/Low Lines: Display the session's high and low prices as horizontal lines, extended beyond the session end.
Equilibrium Line: Shows the midpoint of the session range.
Quartile Lines: Plots 25% and 75% levels within the session range.
Standard Deviation Lines: Displays levels at ±0.5, ±1.0, ±1.33, ±1.66, and ±2.0 standard deviations, with optional extended levels up to ±4.0.
Deviation Boxes: Shaded boxes highlight specific ranges (e.g., ±1.33/1.66) for quick reference.
±0.1 Deviation Lines/Boxes: Optional smaller deviation levels for precise analysis.
Dynamic Updates: During the session, high and low lines update in real-time. At session end, all levels are finalized and extended forward for post-session analysis.
Clearing Mechanism: When a new session begins, previous drawings are cleared to avoid clutter.
Usage
Add to Chart: Apply the indicator to your TradingView chart via the Pine Editor or Indicator menu.
Configure Settings:
Adjust the session window and timezone to match your market (e.g., 09:30–16:00 UTC-4 for US equities RTH).
Customize visibility, colors, styles, and thicknesses to suit your chart preferences.
Enable extended levels for deeper analysis or disable them for simplicity.
Interpret Levels:
High/Low: Act as potential support/resistance or breakout levels.
Equilibrium: Represents the session's midpoint, often a pivot point.
25%/75% Quartiles: Indicate intermediate levels within the session range.
Standard Deviation Levels: Highlight statistically significant price zones for potential reversals or breakouts.
Boxes: Emphasize key zones for quick visual reference.
Trading Application: Use levels to identify entry/exit points, set stop-losses, or gauge market volatility.
For example, ±1.0 standard deviation levels often act as strong support/resistance, while ±2.0 levels may indicate overextension.
Notes
Ensure the session window aligns with the market’s trading hours for accurate calculations.
The indicator is designed for intraday and post-session analysis but can be adapted for other timeframes.
Use in conjunction with other technical analysis tools for comprehensive decision-making.
Extended levels (±2.25 and beyond) are disabled by default to reduce chart clutter but can be enabled for specific strategies.
TradingView House Rules Compliance
This indicator contains no copyrighted material and adheres to TradingView’s Pine Script guidelines.
This indicator was approved and created with @TIMELESS1_

[FS] Time & Cycles Time & Cycles
A comprehensive trading session indicator that helps traders identify and track key market sessions and their price levels. This tool is particularly useful for forex and futures traders who need to monitor multiple trading sessions.
Key Features:
• Multiple Session Support:
- London Session
- New York Session
- Sydney Session
- Asia Session
- Customizable TBD Session
• Session Visualization:
- Clear session boxes with customizable colors
- Session labels with adjustable visibility
- Support for sessions crossing midnight
- Timezone-aware calculations
• Price Level Tracking:
- Daily High/Low levels
- Weekly High/Low levels
- Previous session High/Low levels
- Customizable history depth for each level type
• Customization Options:
- Adjustable colors for each session
- Customizable border styles
- Label visibility controls
- Timezone selection
- History level depth settings
• Technical Features:
- High-performance calculation engine
- Support for multiple timeframes
- Efficient memory usage
- Clean and intuitive visual display
Perfect for:
• Forex traders monitoring multiple sessions
• Futures traders tracking market hours
• Swing traders identifying key session levels
• Day traders planning their trading hours
• Market analysts studying session patterns
The indicator helps traders:
- Identify active trading sessions
- Track session-specific price levels
- Monitor market activity across different time zones
- Plan trades based on session boundaries
- Analyze price action within specific sessions
Note: This indicator is designed to work across all timeframes and is optimized for performance with minimal impact on chart loading times.

SEJKING - TimingSEJKING - Timing Indicator: Professional Session-Based Trading Tool
The SEJKING - Timing indicator is a sophisticated trading tool designed for intraday traders who focus on key market sessions. It provides visual cues for Asian, London, and New York trading sessions, highlights important price levels, and delivers volatility metrics - all in one comprehensive package.
Key Features:
Session Visualization:
Color-coded boxes for Asian (purple), London (gray), and New York (gray) sessions
Automatic Daylight Saving Time adjustments (2022-2025)
Customizable colors and visibility for each session
Volatility Measurement:
Real-time pip count calculations for each session
Visual labels showing range volatility (A=Asian, L=London, N=New York)
Critical Price Levels:
Daily Levels:
Previous day's high/low as black dashed lines (HOPD/LOPD)
Lines extend until 5 AM EST the following day
"HOPD" (High of Previous Day) and "LOPD" (Low of Previous Day) labels
Weekly Levels:
Previous week's high/low as orange dashed lines
Lines extend until following Wednesday at 5 AM EST
"WH" (Weekly High) and "WL" (Weekly Low) labels at line ends
Smart Timeframe Handling:
Auto-hides elements on higher timeframes (15-30 minute setting)
Special handling for Asian session on higher timeframes
Key Reference Lines:
Yesterday's high, low, and close
Weekly high and low levels
Option to display only on most recent bar
Benefits for Traders:
Session Awareness: Visually track active market sessions to align with peak volatility periods
Key Level Identification: Quickly spot crucial support/resistance from daily and weekly levels
Volatility Gauge: Measure session range strength through pip counts
Time-Based Analysis: Extended lines help identify which levels remain relevant throughout the trading day
DST-Proof: Automatically adjusts for global daylight saving time changes
Ideal For:
Forex traders focusing on London/NY sessions
Asian session specialists
Price action traders using previous day/week levels
Volatility-based strategies
Intraday traders needing session awareness
Input Options:
Toggle visibility for each trading session
Customize Asian session colors
Set maximum timeframe for box visibility (15-30 mins)
Choose to display key levels only on recent bars
How It Works:
The indicator automatically calculates session timings based on UTC-7 (US Mountain Time), with intelligent DST adjustments. At the start of each Asian session, it plots new daily and weekly levels, extending them to their respective expiration times (5 AM EST next day for daily, next Wednesday for weekly). Session boxes show the price range during each market open, with pip counts displayed at session close.
Trading Applications:
Use HOPD/LOPD as breakout or reversal levels
Trade bounces off weekly levels (WH/WL)
Identify low-volatility sessions for range trading
Spot high-volatility sessions for breakout strategies
Combine session boxes with key levels for confluence
Note: Optimized for Forex but works on all instruments. Asian session hours automatically adjust for non-Forex assets.

TradeJorno - Time + Price Levels
Tired of manually drawing and updating important ICT or SMC time and price levels on your charts every day?
Here’s an indicator to draw important TIME and PRICE levels automatically.
Here’s what you can highlight in realtime on your charts:
1. Previous major highs and lows
⁃ Previous daily and weekly highs and low
- Weekly dividing lines
2. Session highs/lows
⁃ Plot the high and low of Asia and London sessions.
⁃ Customise the timeframe and appearance on the chart.
- Previous session settlement price.
3. Various price levels
⁃ Pre-market opening prices : midnight, 7:30 and 8:30
⁃ Regular market opening prices: 9:30, 10:00, 14:00
- end of session settlement prices
4. Market opening range high and low
⁃ Lines extending throughout the current session
⁃ Customise the timeframe and appearance on the chart.
5. ICT Macro times
- Draw customisable vertical lines and labels to indicate the start of each ICT macro
period.
Let us know in the comments below if there’s anything else we need to add!

Previous Two Days HL + Asia H/L + 4H Vertical Lines📊 Indicator Overview
This custom TradingView indicator visually marks key market structure levels and session data on your chart using lines, labels, boxes, and vertical guides. It is designed for traders who analyze intraday and multi-session behavior — especially around the New York and Asia sessions — with a focus on 4-hour price ranges.
🔍 What the Indicator Tracks
1. Previous Two Days' Ranges (6PM–5PM NY Time)
PDH/PDL (Day 1 & Day 2): Draws horizontal lines marking the previous two trading days’ highs and lows.
Midlines: Calculates and displays the midpoint between each day’s high and low.
Color-Coded: Uses strong colors for Day 1 and more transparent versions for Day 2, to help differentiate them.
2. Asia Session High/Low (6 PM – 2 AM NY Time)
Automatically tracks the high and low during the Asia session.
Extends these levels until the following day’s NY close (4 PM).
Shows a midline of the Asia session (optional dotted line).
Highlights the Asia session background in gray.
Labels Asia High and Low on the chart for easy reference.
3. Last Closed 4-Hour Candle Range
At the start of every new 4H candle, it:
Draws a box from the last closed 4H candle.
Box spans horizontally across a set number of bars (adjustable).
Top and bottom lines indicate the high and low of that 4H candle.
Midline, 25% (Q1) and 75% (Q3) levels are also drawn inside the box using dotted lines.
Helps traders identify premium/discount zones within the previous 4H range.
4. Vertical 4H Time Markers
Draws vertical dashed lines to mark the start and end of the last 4H candle range.
Based on the standard 4H bar timing in NY (e.g. 5:00, 9:00, 13:00, 17:00).
⚙️ Inputs & Options
Line thickness, color customization for all levels.
Option to place labels on the right or left side of the chart.
Toggle for enabling/disabling the 4H box.
Adjustable box extension length (how far to extend the range visually).
✅ Ideal Use Cases
Identifying reaction zones from prior highs/lows.
Spotting reversals during Asia or NY session opens.
Trading intraday setups based on 4H structure.
Anchoring scalping or swing entries off major session levels.
